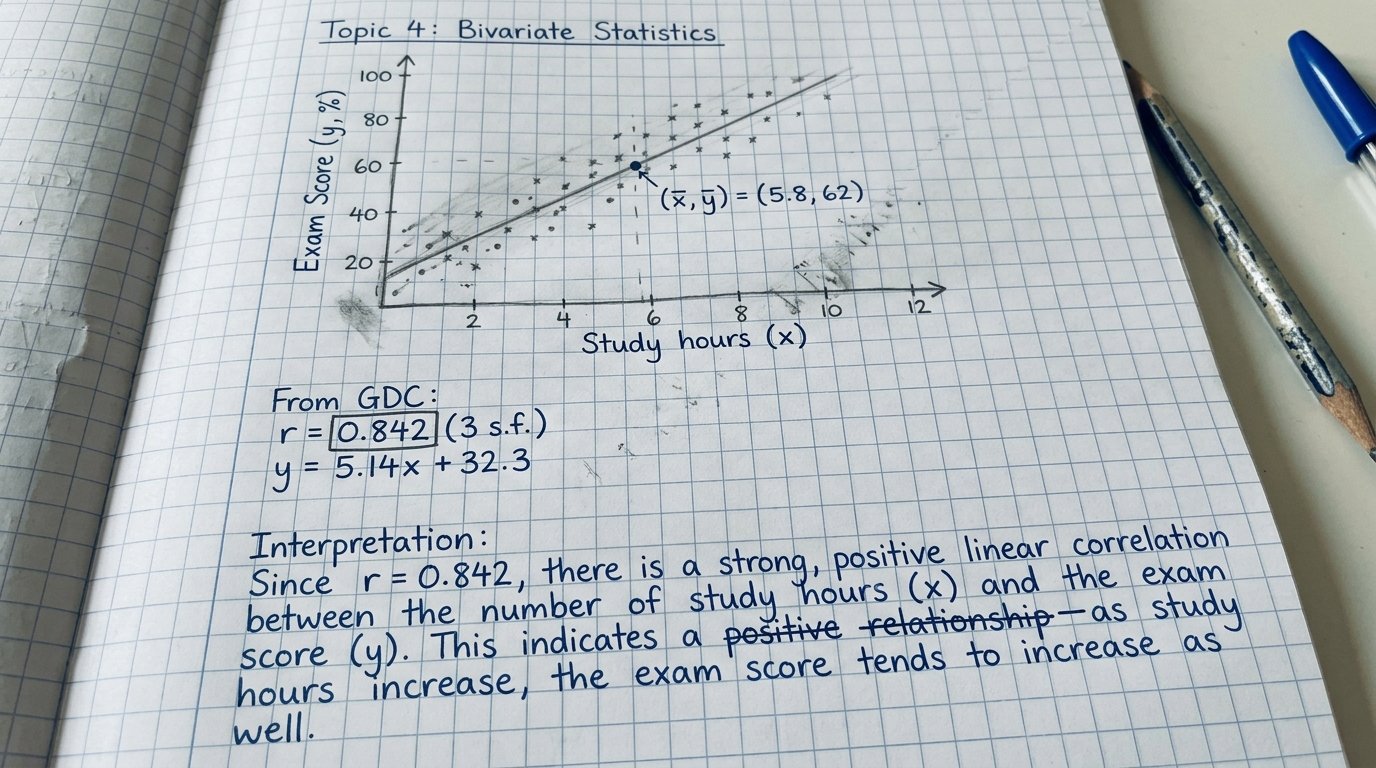
You enter the data into your calculator.
You calculate the correlation coefficient.
You find the regression equation.
The numbers look correct, so you move on.
But then the question asks you to interpret the result in context, and you are not sure what to write.
This is where many students struggle with interpret statistics in IB Math AI (Applications and Interpretation). They can perform the calculation but struggle to explain what the result means.
A numerical answer is only part of a statistical solution. You also need to understand what the number tells you, what it does not tell you, and how it relates to the situation described in the question.
This distinction matters because statistics is not simply about producing numbers. It is about using data to understand a situation while recognising the limitations of the evidence.
Table of Contents
Quick answer
To interpret a statistical result in IB Math AI, state what the result means in the context of the question, support your explanation with the relevant value, and avoid claiming more than the data can establish.
For correlation, describe the direction and strength of the relationship. For regression, explain what the model predicts and whether the prediction is appropriate. For hypothesis testing, relate the decision to the stated hypotheses and significance level.
Always connect the mathematics to the real situation.
1. Why calculating the answer is not enough

Imagine a question investigates the relationship between the number of hours students revise and their mathematics test scores.
You enter the data into your calculator and obtain a correlation coefficient of r=0.82.
You write:
[
r=0.82
]
The calculation may be correct, but the question asks you to interpret the result.
Your answer needs to explain the meaning of the coefficient.
A stronger response would be:
There is a strong positive linear association between revision time and test scores in the students represented by this data.
This sentence communicates more than the numerical value.
It identifies the direction of the relationship, describes its strength and connects it to the variables in the question.
The number is evidence. The interpretation explains that evidence.
2. Use a simple structure for interpretation questions
When you are asked to interpret a statistical result, use three steps.
Step 1: State the statistical meaning.
Is the relationship positive or negative? Is it strong or weak? Does the result suggest a difference, an association, or a prediction?
Step 2: Connect it to the context.
Name the actual variables, population, or situation from the question.
Step 3: State a relevant limitation when appropriate.
Does the conclusion apply only to the observed data? Is the model being used outside its reliable range? Could other variables influence the relationship?
You do not need to write a long paragraph for every question. A concise, precise interpretation is often better than several vague sentences.
The key is to answer the question that was asked.
3. How to interpret a correlation coefficient

The correlation coefficient (r) describes the direction and strength of a linear relationship between two quantitative variables.
Its value lies between (-1) and (1).
A value near (1) indicates a strong positive linear relationship.
A value near (-1) indicates a strong negative linear relationship.
A value near (0) indicates little or no linear relationship. However, a coefficient near zero does not rule out every possible nonlinear relationship.
Consider the revision example.
If (r=0.82), the relationship is positive and relatively strong.
If (r = -0.76), the relationship is negative and relatively strong.
If r=0.08, the data show little linear association.
The exact description of strength depends on context and the conventions used in your course or question. Avoid treating every coefficient as if it had a universally agreed category.
A common mistake: confusing correlation with causation
Suppose students who revise for longer tend to achieve higher test scores.
You cannot automatically conclude that additional revision caused the higher scores.
Other factors may be involved. Students who revise more may also attend lessons more consistently, have stronger prior knowledge, or use different study methods.
A safer interpretation is:
The data show a positive association between revision time and test scores. This association alone does not establish that revision time causes higher scores.
This distinction is fundamental to responsible statistical reasoning.
4. How to interpret a regression equation
A regression equation describes a model for the relationship between variables.
Suppose a model relating revision time (x), measured in hours, to predicted test score (y) is:
[
y=12+6x
]
The slope is (6).
In the context of this model, each additional hour of revision is associated with an increase of six points in the predicted test score.
Notice the wording: predicted test score.
The equation does not guarantee that an individual student will gain six points for every additional hour of revision.
It describes the fitted relationship in the data.
The intercept is (12). Mathematically, this is the predicted score when x=0. Whether that prediction is meaningful depends on the data and the situation.
If the model was fitted using students who revised between two and eight hours, interpreting the intercept may require caution because zero hours falls outside the observed range.
What to include in a regression interpretation
When interpreting a regression equation, identify:
- What the explanatory variable represents.
- What the response variable represents.
- What the slope means in the context.
- Whether the intercept is meaningful.
- Whether the prediction is being made within the observed data range.
You do not need all five points in every answer. Choose the points relevant to the question.
5. Understand the difference between interpolation and extrapolation
Suppose your data cover revision times between two and eight hours.
You use the regression equation to predict a score for a student who revises for five hours.
This is interpolation because the value lies within the observed range.
Now suppose you predict the score for a student who revises for twenty hours.
This is extrapolation because the value lies outside the observed range.
The second prediction is more questionable.
The relationship observed in the original data may not continue beyond the measured range.
There may also be practical limits. Revision time may not relate to performance in a consistent way at very high values.
When a question asks you to comment on a prediction, check whether the explanatory variable lies within the data range and whether the model is sensible for that situation.
6. How to interpret a coefficient of determination
The coefficient of determination is commonly written as (R^2).
Suppose:
[
R^2=0.81
]
In a suitable simple linear regression context, this means that 81 percent of the variation in the observed response variable is explained by the fitted linear relationship with the explanatory variable.
It does not mean that the model is 81 percent accurate.
It does not mean that 81 percent of students will receive the predicted score.
It does not establish that one variable causes the other.
A strong answer identifies what the percentage refers to and names the variables.
For example:
The fitted linear model explains 81 percent of the variation in the observed test scores using revision time.
That is more precise than writing, “The model is 81 percent correct.”
Always check the exact statistic provided and the model being used before interpreting it.
7. How to interpret a hypothesis test
Hypothesis testing introduces a different kind of interpretation.
You may be given a null hypothesis, an alternative hypothesis, and a significance level.
Your task may involve using a test statistic or a probability value to make a decision.
Suppose the significance level is (5%), and the calculated probability value is (0.03).
Because (0.03) is less than (0.05), you reject the null hypothesis under the stated testing procedure.
But the conclusion should not stop there.
You should relate the decision to the question.
If the null hypothesis states that there is no association between two variables, the conclusion could be:
At the five per cent significance level, there is sufficient statistical evidence to reject the hypothesis of no association between the variables.
The exact wording depends on the hypotheses.
Avoid saying that the null hypothesis has been proved false.
A statistical test provides evidence for a decision under a particular procedure. It does not prove a hypothesis with absolute certainty.
Similarly, failing to reject the null hypothesis does not prove that it is true.
It means the evidence was insufficient to reject it at the chosen significance level.
These distinctions make your conclusion more accurate.
8. Interpret statistical results in context.
One of the most useful habits is to include the actual variables in your final statement.
Compare these responses.
Weak: There is a negative correlation.
Better: There is a negative linear association between daily screen time and the reported sleep duration in the observed students.
The second response tells the reader what the result refers to.
The same principle applies to regression.
Weak: The slope is six.
Better: The model predicts a 6-point increase in test scores for each additional hour of revision.
And to hypothesis testing.
Weak: Reject the null hypothesis.
Better: At the stated significance level, the data provide sufficient evidence to support the alternative hypothesis that the population means differ.
The final example is appropriate only if the alternative hypothesis actually concerns a difference between population means.
Do not use a memorised sentence without checking the hypotheses in the question.
9. Recognise common interpretation mistakes
Here are several mistakes worth checking in your own answers.
Treating association as causation
A relationship between variables does not automatically establish that one causes the other.
Describing a regression prediction as a certainty
A model provides an estimate, not a guarantee about an individual outcome.
Calling (R^2) the percentage accuracy
The statistic describes variation explained by the fitted model in the relevant regression setting.
Ignoring the units of the slope
If the explanatory variable is measured in hours and the response variable in points, the slope represents predicted points per hour.
Making predictions far outside the data range without qualification
Extrapolation can be unreliable because the observed relationship may not continue.
Giving a conclusion without naming the variables
A correct statistical term may still leave the interpretation incomplete if it is not connected to the situation.
Writing too much without answering the question
A long explanation does not compensate for an unclear conclusion. State the result directly, then include the relevant context and limitations.
10. A practical way to improve your interpretation skills
You can practise statistical interpretation separately from calculation.
Choose a set of IB Math AI questions involving correlation, regression, probability distributions or hypothesis testing.
For each question, complete the calculation first.
Then cover the numerical working and answer these questions in words:
What does the result tell me?
Which variables or population does it concern?
What conclusion can I reasonably draw?
What can I not conclude from this result alone?
Compare your interpretation with the expected solution or your teacher’s feedback.
Pay attention to the difference between a mathematical error and an interpretation error. You may calculate the correct value but describe it incorrectly.
Keep a short record of recurring problems, such as confusing correlation with causation or interpreting (R^2) as accuracy.
Then practise new questions that require the same type of reasoning.
11. How Mathzem can support statistical practice
Mathzem helps IB Mathematics students practise exam-style questions and learn from their own attempts.
Students can choose a course and topic, solve a question, upload their handwritten working and review AI Examiner feedback. Depending on the attempt, the feedback can provide estimated marks, identify mistakes, highlight weak areas, or suggest next steps.
For statistics questions, this can help you review both the mathematical procedure and the written interpretation.
For example, you might calculate a regression equation correctly but write a conclusion that claims causation. Reviewing that mistake gives you a specific skill to practise next: describing association accurately and recognising the limits of the model.
AI feedback is not official IB marking, and a single correct interpretation does not prove mastery. Use the feedback alongside your teacher’s guidance, course materials and official assessment resources.
Five FAQs About Interpret statistics in IB Math AI
1. How do I interpret a correlation coefficient in IB Math AI?
Describe the direction and strength of the linear relationship, then identify the variables involved. Do not claim that correlation proves causation.
2. What does (R^2) mean in a regression question?
In a suitable simple linear regression context, (R^2) describes the proportion of variation in the response variable explained by the fitted linear model. It is not a percentage accuracy score.
3. How do I interpret the slope of a regression line?
Explain the predicted change in the response variable for a one-unit increase in the explanatory variable. Include the relevant variables and units.
4. What should I write after a hypothesis test?
State the decision using the specified significance level, then explain what that decision means in the context of the hypotheses. Do not claim that the null hypothesis has been proved true or false.
5. How can I improve at IB Math AI interpretation questions?
Practise writing conclusions after calculations. Name the variables, explain what the result means, check whether the conclusion is justified and mention relevant limitations when the question asks for them.
Final takeaway
In IB Math AI, producing the correct statistical value is only part of the task.
You also need to explain what the result means.
When you interpret a correlation coefficient, describe the relationship. When you use regression, explain the prediction and its limitations. When you conduct a hypothesis test, state the decision and connect it to the hypotheses.
The most reliable habit is simple:
Calculate carefully. Interpret precisely. Check what the evidence actually supports.
That is how you turn statistical output into a clear mathematical conclusion.
Practise the full process: solve an IB-style question, show your working, review the feedback and use your mistakes to guide the next practice session with Mathzem.