Introduction to Student Dashboard
Many online learning platforms are very good at delivering content.
Students can watch videos, complete exercises, and access resources whenever they want.
But after several weeks, many students start asking the same questions:
What should I study next?
Which topics am I improving in?
Where am I losing marks?
Am I actually making progress?
Unfortunately, many platforms cannot answer those questions.
Table of Contents
Completing lessons is not the same as learning
Many dashboards focus on completion statistics.
Students see numbers like
• 32 videos watched.
• 15 quizzes completed.
• 20 hours studied.
These numbers can feel encouraging.
Unfortunately, they don’t tell students whether they are becoming better at mathematics.
Watching more videos does not automatically improve exam performance.
Completing more lessons does not guarantee stronger understanding.
Students need information that goes beyond activity tracking.
Students need visibility into their learning
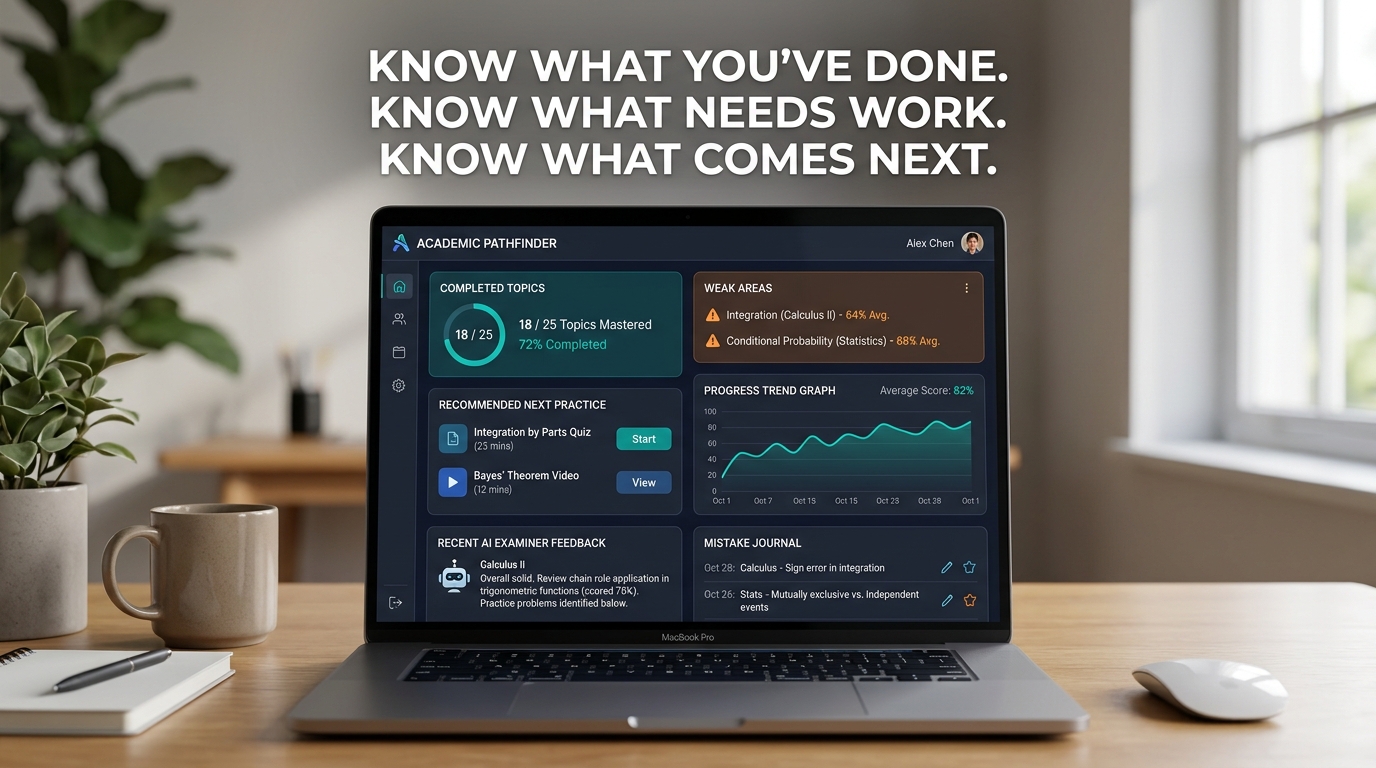
A useful dashboard should help students understand their own progress.
It should answer three questions immediately:
• What have I completed?
• What am I struggling with?
• What should I do next?
Without these answers, revision becomes guesswork.
Students often spend time revising topics they already know while ignoring the topics that cost them marks in exams.
Why weak area identification matters
Most students can guess which topics they find difficult.
The problem is that guesses are often wrong.
A topic that feels difficult may actually produce strong results.
Meanwhile, a topic that feels comfortable may consistently lose marks through small mistakes.
Data often reveals patterns that students would never notice themselves.
That is why identifying weak areas accurately is one of the most valuable features of a learning dashboard.
The importance of a weakness map
A weakness map gives students a visual overview of their learning.
Instead of seeing a single percentage score, students can see performance across individual topics.
For example:
Strong topics:
• Functions
• Sequences and Series
• Differentiation
Topics needing attention:
• Integration
• Hypothesis Testing
• Conditional Probability
This allows revision time to be spent where it creates the biggest improvement.
Students need direction, not just information
Knowing your weak areas is useful.
Knowing what to do next is even more important.
A strong dashboard should recommend the following:
• Which topic to revise next.
• Which questions to practise.
• Which mistakes are repeating.
• Which skills are improving.
Students spend less time deciding what to study and more time learning.
Why progress tracking improves motivation
One of the hardest parts of studying is feeling like nothing is improving.
Students often work hard for weeks without noticing gradual progress.
A dashboard solves this problem by making improvements visible.
Students can see:
• Scores increasing over time.
• Weak topics becoming stronger.
• Mistakes becoming less frequent.
• Confidence growing across different areas.
Progress becomes measurable instead of emotional.
The role of the mistake journal
Many mistakes disappear as soon as students finish reviewing a question.
Unfortunately, the same mistakes often return later.
A mistake journal changes this.
Students can revisit previous errors, recognize patterns, and avoid repeating them in future assessments.
Over time, this becomes one of the most valuable revision tools available.
How Mathzem uses the Student Dashboard
Mathzem’s Student Dashboard was designed around one simple goal:
Help students understand their learning as clearly as possible.
The dashboard allows students to:
• View strong and weak topics.
• Track progress over time.
• Access their mistake journal.
• Review AI examiner feedback.
• Follow personalised revision recommendations.
• Build revision plans based on actual performance.
Instead of guessing what needs work, students can focus their attention where it matters most.
Better data creates better decisions
Students make hundreds of study decisions every year.
Which topic should I revise?
Which questions should I practice?
Should I move on or spend more time here?
The quality of those decisions often determines exam results.
Good dashboards improve those decisions by replacing assumptions with evidence.
Final thoughts
Online learning platforms should do more than store videos and worksheets.
They should help students understand their own learning journey.
A good student dashboard provides clarity, direction, and motivation.
For IB Maths students, that can make the difference between studying harder and studying smarter.
Frequently Asked Questions About Student Dashboard
What is a student dashboard?
A student dashboard is a learning tool that tracks progress, identifies weak areas, and helps students decide what to study next.
Why are dashboards important in online learning?
Dashboards help students understand their performance and make better decisions about revision and practice.
What is a weakness map?
A weakness map shows performance across individual topics so students can focus revision on the areas that need improvement most.
What is a mistake journal?
A mistake journal records previous errors so students can review them and avoid repeating the same mistakes in future assessments.
How does Mathzem’s student dashboard help students?
Mathzem helps students track progress, identify weak areas, review mistakes, receive AI examiner feedback, and follow personalised revision plans.