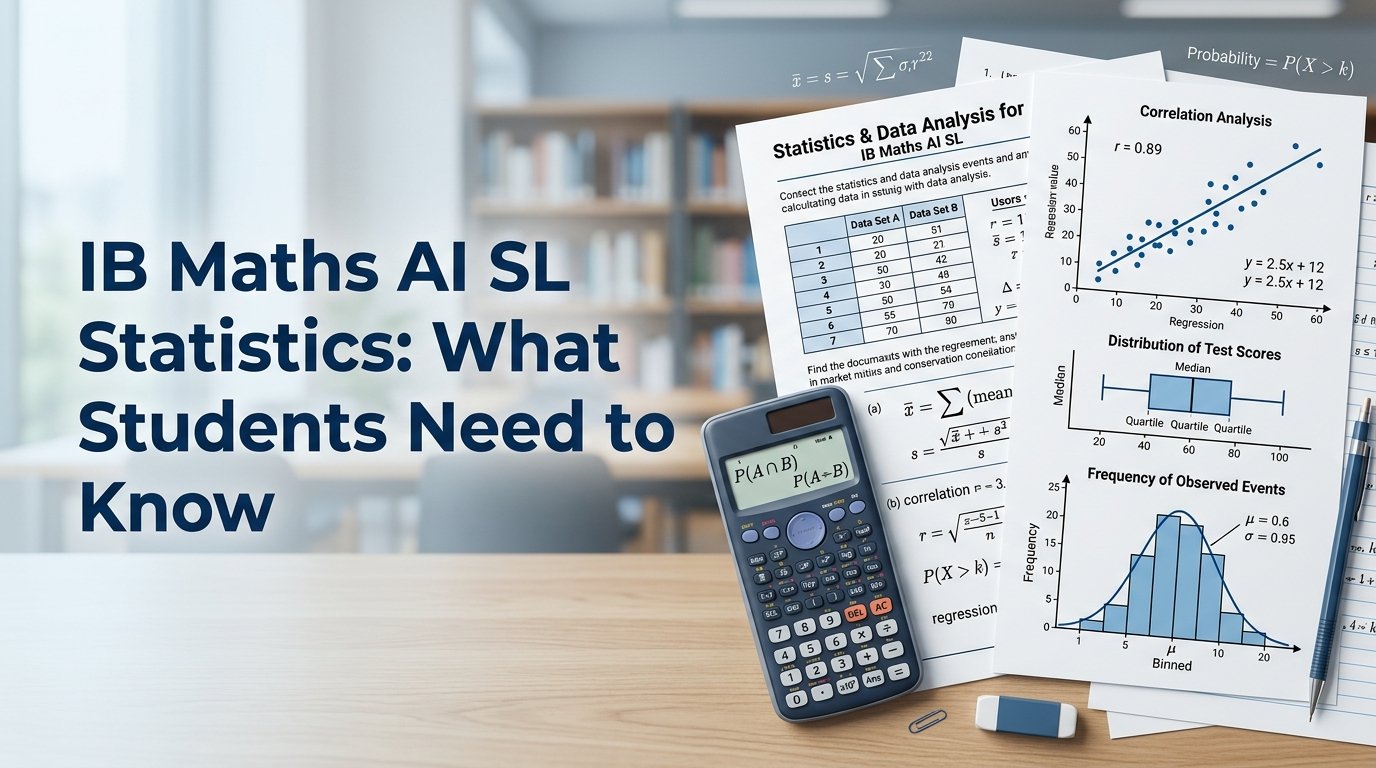
Statistics is one of the most practical parts of IB Maths AI SL.
Instead of working only with abstract equations, you’re often asked to analyse data, choose appropriate statistical methods, use technology, and explain what your results mean.
The IB specifically describes the Statistics and Probability content as an area where students should understand the techniques being used and interpret results in context. Technology also plays an important role in statistical calculations and analysis.
That means successful revision isn’t simply memorising formulas.
You need to know:
What information do I have?
Which statistical method should I use?
What does the calculator output mean?
Is the result reasonable?
How should I explain it in context?
This guide takes you through the main statistical skills you should develop and shows you how to approach statistics questions more effectively.
Table of Contents
What Should You Know for IB Maths AI SL Statistics?
Your statistics revision should cover several connected skills.
These include:
- • Understanding data
- • Population and sample
- • Sampling methods
- • Bias and reliability
- • Measures of central tendency
- • Measures of dispersion
- • Box and whisker diagrams
- • Histograms
- • Scatter diagrams
- • Correlation
- • Regression
- • Probability distributions
- • Normal distribution
- • Statistical interpretation
- • Technology and calculator skills
The exact emphasis depends on the syllabus version you’re studying, so always check your school’s current course guide.
For students following the current AI SL course, statistics and probability is a major component of the curriculum.

1. Start by Understanding the Data
Before calculating anything, understand what your data represents.
Suppose you’re given a table containing information about students.
You might have: x=hours studied
and: y=test score
Before calculating a mean or creating a graph, ask:
What does each variable represent?
What are the units?
How was the data collected?
Is this a sample or a population?
Could the data contain bias?
These questions can affect how you interpret the results.
2. Population and Sample
A population is the complete group you’re interested in.
A sample is a smaller group selected from that population.
For example, suppose a school has 1,200 students.
If you collect data from all 1,200 students, you’re working with the population.
If you collect data from 100 students, you’re working with a sample.
The important issue is whether the sample provides a reasonable representation of the population.
A badly chosen sample can produce misleading conclusions even when the calculations themselves are correct.
3. Understand Sampling Methods
You should recognise common sampling approaches and understand their strengths and weaknesses.
For example:
Simple Random Sampling
Members are selected randomly from the population.
This can reduce selection bias when performed properly.
Systematic Sampling
Members are selected according to a regular interval.
For example, selecting every tenth person from an appropriate list.
Stratified Sampling
The population is divided into relevant groups, then members are selected from each group.
This can help ensure that important subgroups are represented.
Convenience Sampling
Participants are selected because they’re easy to access.
This can be quick, but it may introduce significant bias.
Quota Sampling
Researchers collect a specified number of people from different groups.
The method can provide representation of groups, but selection within groups may still be nonrandom.
The key exam skill is not just identifying the method.
You should be able to explain why it is appropriate or what limitation it has.
4. Learn to Recognise Sampling Bias
Bias occurs when the way data is collected systematically affects the results.
Imagine a school wants to find out how students feel about the school cafeteria.
If the survey is conducted only during lunchtime in the cafeteria, the sample might not represent students who bring food from home or eat elsewhere.
The problem isn’t the calculation.
It’s the data collection process.
When revising sampling, ask:
Who was included?
Who was excluded?
How were participants selected?
Could the method favour one group?
This type of reasoning is important in statistical interpretation.
5. Measures of Central Tendency
You should understand the main ways of describing the centre of a dataset.
Mean
The mean is calculated by: xˉ=n∑x
It uses every value in the dataset.
Median
The median is the middle value when the data is ordered.
Mode
The mode is the most frequently occurring value.
Each measure gives you different information.
For example, if a dataset contains a major outlier, the mean can be affected significantly while the median may remain more stable.
6. Understand the Effect of Outliers
Outliers are observations that are unusually far from the rest of the data.
Consider: 10, 11, 12, 13, 14
Now add: 100
The mean changes dramatically.
The median changes much less.
This is why you shouldn’t simply calculate a measure and stop.
Ask:
Is the dataset affected by outliers?
Which measure of centre is more appropriate?
The IB syllabus specifically includes interpretation of outliers and links this to measures of dispersion and box and whisker diagrams.
7. Measures of Dispersion
Central tendency tells you where the data is centred.
Dispersion tells you how spread out the data is.
You may work with measures such as:
Range Range=maximum−minimum
and:
Interquartile range IQR=Q3−Q1
You should also understand standard deviation and what it tells you about the spread of data.
A larger standard deviation generally indicates that the values are more spread out around the mean.
But don’t interpret standard deviation without considering the dataset and context.
8. Box and Whisker Diagrams
Box plots provide a visual summary of a dataset.
They can help you identify:
• Median
• Lower quartile
• Upper quartile
• Spread
• Potential outliers
They are particularly useful when comparing datasets.
Suppose two classes have similar median test scores.
That doesn’t necessarily mean their performances are similar.
One class might have a much wider spread of results.
The box plots can reveal this immediately.
9. Histograms
A histogram represents the distribution of continuous data using intervals.
Don’t confuse a histogram with a bar chart.
In a histogram, the data represents intervals of a continuous variable.
The shape of the histogram can help you understand whether the distribution is:
• Approximately symmetric
• Positively skewed
• Negatively skewed
• Concentrated around certain intervals
• Spread widely across the range
When interpreting a histogram, describe what you actually see rather than simply saying:
“The graph is good.”
Use statistical language.
10. Scatter Diagrams
Scatter diagrams help you investigate relationships between two variables.
For example: x=hours studied y=exam score
You might observe a positive association if larger values of x generally correspond to larger values of y.
You might observe a negative association if larger values of x generally correspond to smaller values of y.
Or there may be little or no clear linear association.
Look at the whole pattern
Don’t judge correlation from two or three points.
Look at the overall distribution.
11. Understand Correlation
Correlation describes the strength and direction of a linear relationship between two variables.
A value close to: +1
indicates a strong positive linear relationship.
A value close to: −1
indicates a strong negative linear relationship.
A value near: 0
suggests little linear correlation.
But remember:
Correlation does not automatically imply causation.
If two variables are strongly correlated, that doesn’t prove that one causes the other.
12. Regression
Regression allows you to model the relationship between variables.
For example, a linear regression model might take the form: y=a+bx
where a is the intercept and b represents the slope.
You can use the model to make predictions.
But always consider whether the prediction is sensible.
If your data covers: 10≤x≤50
then predicting x=25 is interpolation.
Predicting x=150 is extrapolation.
The second prediction requires much more caution.
This connects directly with modelling, which is an important part of AI mathematics.
13. Understand Residuals
A residual measures the difference between an observed value and the value predicted by the model.
Conceptually: Residual=Observed−Predicted
Residual analysis can help you determine whether a model is appropriate.
If residuals show a systematic pattern, your model may not be capturing the structure of the data.
If they appear randomly distributed around zero, the model may be more appropriate.
Don’t treat residuals as just another calculator output.
Understand what they tell you about the model.
14. Learn to Interpret Calculator Output
One of the most important AI SL statistics skills is understanding your calculator output.
Your calculator may provide values such as: xˉ σ r
or regression coefficients.
Don’t simply copy the numbers into your answer.
Ask:
What does this number represent?
What does its size tell me?
What does its sign tell me?
What does it mean in context?
For example, if a regression model gives: y=4.2x+15
the coefficient 4.2 has meaning.
It represents the modelled change in y for each one unit increase in x.
15. Technology Is Part of Statistics Revision
The IB expects students to be familiar with the statistics functionality of permitted technology in examinations.
That means calculator practice should be part of your statistics revision.
Practise:
• Entering data correctly
• Creating statistical plots
• Calculating summary statistics
• Performing regressions
• Finding probabilities
• Working with distributions
• Checking results
• Interpreting calculator output
Don’t leave this until the final week before your exam.
16. Probability and Statistics Are Connected
Statistics and probability shouldn’t always be treated as completely separate topics.
Probability helps you understand distributions and uncertainty.
Statistics helps you analyse observed data.
For example, a probability distribution provides a mathematical representation of possible outcomes, while statistical data represents observations from a real situation.
The IB describes statistical and probabilistic techniques as tools for understanding and making predictions about real world situations.
This is one reason AI SL statistics is strongly connected to modelling.
17. Normal Distribution
The normal distribution is one of the most important distributions to understand.
It has a characteristic bell shaped curve.
If: X∼N(μ,σ2)
then: μ
represents the mean, while: σ
represents the standard deviation.
You should understand how changing the mean or standard deviation affects the distribution.
More importantly, you need to be comfortable using technology to calculate probabilities and interpret the results.
18. Always Translate Probability Into Context
Suppose you calculate: P(X>70)=0.12
Don’t stop there.
Explain what it means.
For example:
There is a probability of 0.12 that a randomly selected observation exceeds 70.
The exact interpretation depends on the context of the question.
This is a small step, but it can make the difference between showing a calculation and demonstrating statistical understanding.
19. Statistical Questions Often Test Interpretation More Than Calculation
This is one of the most important things to understand about AI SL statistics.
Technology can perform many calculations quickly.
So the difficult part is often deciding:
Which technique should I use?
and:
What does the result mean?
The IB’s current guidance specifically emphasises choosing appropriate techniques and understanding and interpreting the results in context.
That means you should spend part of your revision time explaining statistical results in words.
20. A Better Way to Practise Statistics
Use three stages.
Stage 1: Statistical Skills
Practise individual calculations.
For example:
• Mean
• Standard deviation
• Quartiles
• Correlation
• Probability
Stage 2: Interpretation
Given a calculator output or graph, explain what it means.
Stage 3: Mixed Questions
Complete longer exam questions where you must decide:
What information matters?
Which statistical technique should I use?
How should I interpret the result?
This third stage is where your exam readiness really develops.
21. Use Your Mistakes as Statistical Data
Your mistakes can tell you exactly what to revise.
Suppose you complete 20 statistics questions.
You lose marks because of:
| Error Type | Questions | Revision Need |
|---|---|---|
| Calculator entry | 2 | Calculator practice |
| Interpretation | 3 | Context questions |
| Model selection | 1 | Review statistical methods |
| Formula knowledge | 0 | No major concern |
| Graph interpretation | 2 | Graph practice |
Now your next revision session has a clear purpose.
Instead of writing:
“Revise statistics.”
you can write:
“Practise interpreting standard deviation and correlation results.”
That’s much more useful.
22. Use a Statistics Weakness Map
Create a simple system:
🟢 Green: I can solve and explain questions independently.
🟡 Yellow: I understand the topic but make occasional errors.
🔴 Red: I struggle to choose the method or interpret the result.
For example:
| Topic | Status | Next Step |
|---|---|---|
| Mean and median | 🟢 | Mixed practice |
| Standard deviation | 🟢 | Exam questions |
| Box plots | 🟡 | Interpretation practice |
| Correlation | 🟡 | Review examples |
| Regression | 🔴 | Targeted questions |
| Normal distribution | 🔴 | Calculator practice |
You can use the Math Skill Scanner to identify which mathematical skills need more attention.
23. Practise With Complete Solutions
When you practise IB Maths questions, don’t only compare your final answer with the solution.
Review:
What method did I choose?
Was it appropriate?
Did I enter the data correctly?
Did I interpret the calculator output correctly?
Did I answer the question in context?
Did I include appropriate units?
This is especially important for AI SL because technology can perform calculations that students then need to interpret correctly.
24. A 90 Minute AI SL Statistics Revision Session
15 minutes: Review
Choose one statistical area.
For example:
Correlation and regression
Review the key concepts and terminology.
20 minutes: Calculator Practice
Enter a dataset and practise obtaining the relevant statistics.
25 minutes: Exam Questions
Complete several questions without looking at the answers.
15 minutes: Interpretation
For each result, write a sentence explaining what it means in context.
15 minutes: Error Review
Record your mistakes and identify what caused them.
This structure gives you a balance between calculation, technology, interpretation, and exam practice.
25. Common IB Maths AI SL Statistics Mistakes
Mistake 1: Using the Wrong Statistical Method
Don’t choose a method just because your calculator has it.
Understand what the method is designed to do.
Mistake 2: Copying Calculator Output Without Interpretation
A number isn’t an explanation.
Mistake 3: Confusing Correlation With Causation
A strong relationship doesn’t prove cause and effect.
Mistake 4: Ignoring Outliers
Outliers can significantly affect statistical measures and models.
Mistake 5: Forgetting Units
Statistical results often have meaningful units.
Mistake 6: Ignoring the Data Collection Process
Biased data can produce misleading conclusions.
Mistake 7: Treating Extrapolation Like Interpolation
Predictions outside the observed data range require caution.
Mistake 8: Not Checking the Calculator
Incorrect data entry can make every subsequent calculation wrong.
26. Your IB Maths AI SL Statistics Checklist
Data
□ Can I distinguish between population and sample?
□ Can I identify possible sources of bias?
□ Can I recognise common sampling methods?
Descriptive Statistics
□ Can I calculate and interpret mean and median?
□ Can I interpret standard deviation?
□ Can I find and interpret quartiles?
□ Can I calculate and interpret IQR?
Graphs
□ Can I interpret box plots?
□ Can I interpret histograms?
□ Can I interpret scatter diagrams?
□ Can I recognise outliers?
Correlation and Regression
□ Can I interpret correlation?
□ Can I distinguish correlation from causation?
□ Can I interpret regression coefficients?
□ Can I identify interpolation and extrapolation?
Probability and Distributions
□ Can I interpret probabilities?
□ Can I use the normal distribution appropriately?
□ Can I explain probability results in context?
Technology
□ Can I enter data correctly?
□ Can I use my calculator’s statistical functions?
□ Can I perform regression calculations?
□ Can I check calculator output?
Exam Skills
□ Can I choose an appropriate method?
□ Can I explain my answer in context?
□ Can I recognise unreasonable results?
□ Can I evaluate limitations?
Final Thoughts
Good IB Maths AI SL statistics revision isn’t about memorising a long list of formulas.
It’s about learning how to move from:
Data → Statistical method → Technology → Result → Interpretation
You need to understand the data before calculating anything.
You need to choose an appropriate method rather than simply using the first calculator function you remember.
And once you have a result, you need to explain what it means.
The IB places particular emphasis on practical application, technology, appropriate technique selection, and interpretation in context for the Statistics and Probability topic.
That’s why your revision should include more than calculation drills.
Practise reading graphs.
Interpret calculator output.
Explain statistical results in words.
Evaluate sampling methods.
Identify bias.
Compare models.
And analyse your mistakes.
If you want to identify your weaker mathematical skills, use the Math Skill Scanner.
When you’re ready to practise, practise IB Maths questions and review the complete reasoning behind each answer.
For a more structured approach to IB Maths practice and revision, you can also explore Mathzem membership options.
The goal isn’t simply to calculate a statistic.
It’s to understand what the statistic tells you, how reliable it is, and what it means in the real situation.
FAQs About IB Maths AI SL Statistics
1. What topics are included in IB Maths AI SL statistics?
Important areas include data collection, sampling, bias, measures of central tendency and dispersion, data representations, correlation, regression, probability, distributions, and statistical interpretation.
2. Is statistics difficult in IB Maths AI SL?
Statistics can be challenging because students need to combine calculator skills with interpretation and decision making. Understanding why a method is appropriate is often just as important as performing the calculation.
3. How should I revise AI SL statistics?
Start with individual statistical skills, then practise interpreting graphs and calculator results. Finally, complete mixed exam questions where you have to decide which statistical technique is appropriate.
4. Do I need to know how to use my calculator for AI SL statistics?
Yes. The IB expects students to be familiar with the statistics functionality of permitted technology in examinations.
5. How can I improve my statistics exam marks?
Analyse your mistakes. Identify whether the problem was choosing the wrong method, entering data incorrectly, misunderstanding a graph, interpreting a result incorrectly, or failing to explain your answer in context.